- SHIB remains within a narrowing structure, with $0.0000052 serving as an important support area during the latest recovery phase.
- Daily short-selling has declined sharply since July, although outstanding short positions have climbed above 11 million.
- Ecosystem development now centers on converting strong community recognition into recurring usage, liquidity, and activity across products.
SHIB is testing a narrowing structure as buyers defend recent support and selling pressure gradually cools. The market remains caught between lower resistance and rising support. Meanwhile, broader positioning and ecosystem activity continue shaping the current setup.
Daily Structure Narrows Around Key Levels
The daily chart shows a prolonged decline following the May peak near $0.0000066. Lower highs and lower lows continued through June and early July. Selling eventually drove price toward $0.0000041-$0.0000043, where buyers established support.
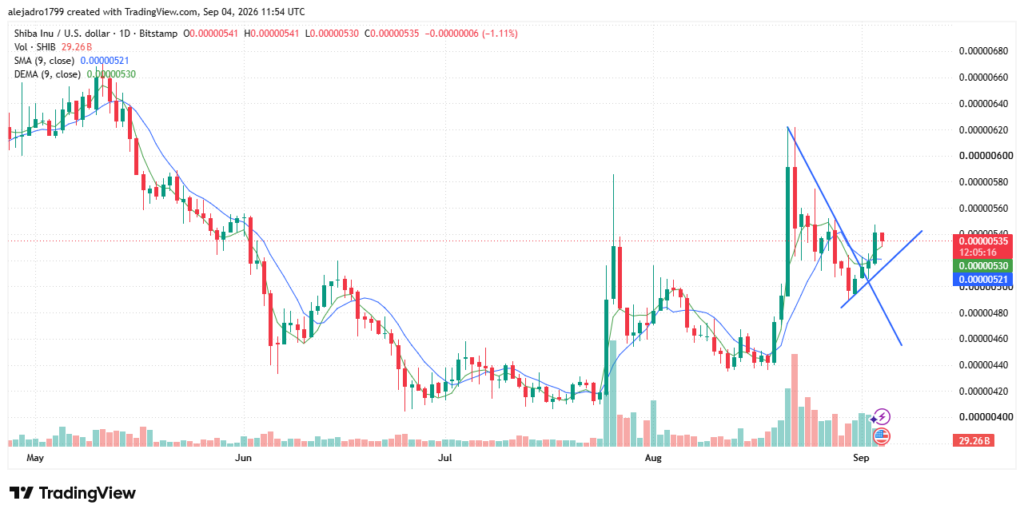
The structure changed during late July after volume expanded sharply. Price then rallied toward $0.0000059 before another pullback developed. However, subsequent trading produced higher lows around the lower boundary.
Two trendlines now converge across the recent trading structure. The descending line connects the $0.0000062 rejection with later lower highs. The rising line links higher lows formed since the August bottom.
The price of SHIB at the time of writing is approximately $0.00000533 per day. The 9-day SMA is around $0.00000521 and the price is slightly higher. This is in addition to being marginally above the 9-day DEMA around $0.00000530.
Short Selling Declines After July Surges
Daily short-sale volume remained relatively contained through late June and early July. Most sessions recorded less than one million shares during that period. However, July 9 produced a sharp increase to approximately 4.5 million shares.
Another surge followed on July 14, when short volume reached roughly 3.5 million shares. Both spikes appeared alongside weakness in the closing-price line. Price subsequently moved toward the lower $50s and then low-$40s.
After those July peaks, daily short-selling activity declined steadily across later sessions. Most subsequent readings remained below one million shares. By late August and early September, activity appeared considerably more subdued.
Short interest, however, continued moving higher during the broader period. The number of positions picked up in 2024 and 2025 was approximately 6-8 million. This increased during 2026, albeit slowly, to more than 11 million.
Ecosystem Usage Remains Central to Market Structure
The immediate resistance zone sits between $0.0000054-$0.0000056. Several recent candles encountered selling across that area. Above it, the descending trendline remains the next technical barrier.
Support around $0.0000052 now aligns closely with the moving averages. A break below that level would weaken the current recovery structure. Lower support then appears around $0.0000048-$0.0000046.
The broader commentary focuses on converting recognition into sustained product usage. Applications, liquidity, and recurring participation remain key development measures. The comparison with TON also illustrates culture combined with accessible market infrastructure.