Crypto Academic: From despair to euphoria for 11.5 Bitcoin (BTC) in just 12 hours! Bitcoin’s V-shaped reversal—has the real rally just begun?
This kind of V-shaped reversal easily causes FOMO, making you feel like you’ve missed out on 100 million, leading to chasing the peak; it also easily triggers fear, thinking the rebound is a trap, resulting in selling at the bottom. In my experience, the more dramatic the market, the more you need to stick to your plan: set your entry points, stop-loss, and targets in advance—execute if the conditions are met, wait if they're not. The market isn’t short of opportunities—what’s lacking is keeping your capital alive long enough to seize them. At the 80,000 mark, both bulls and bears have their reasons; the key is using stop-losses well and not turning trading into pure gambling.
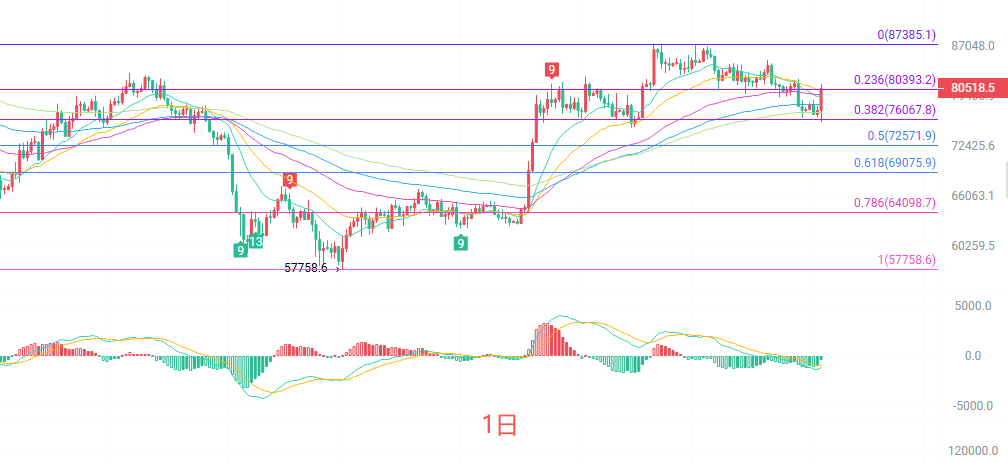
The daily K-line shows a strong bullish candle with a long lower shadow, amplitude over 7%. Technically, price climbed back above the EMA30 and EMA60, but is still operating around 78,224 above the EMA90 as the medium-term averages begin to flatten. The MACD’s DIF line has turned upward above the zero axis, with shrinking green bars—bearish momentum is clearly weakening. Bollinger Bands: upper at 84,283, middle at 80,280, lower at 76,276; current price is right near the middle band, at a critical juncture for direction.
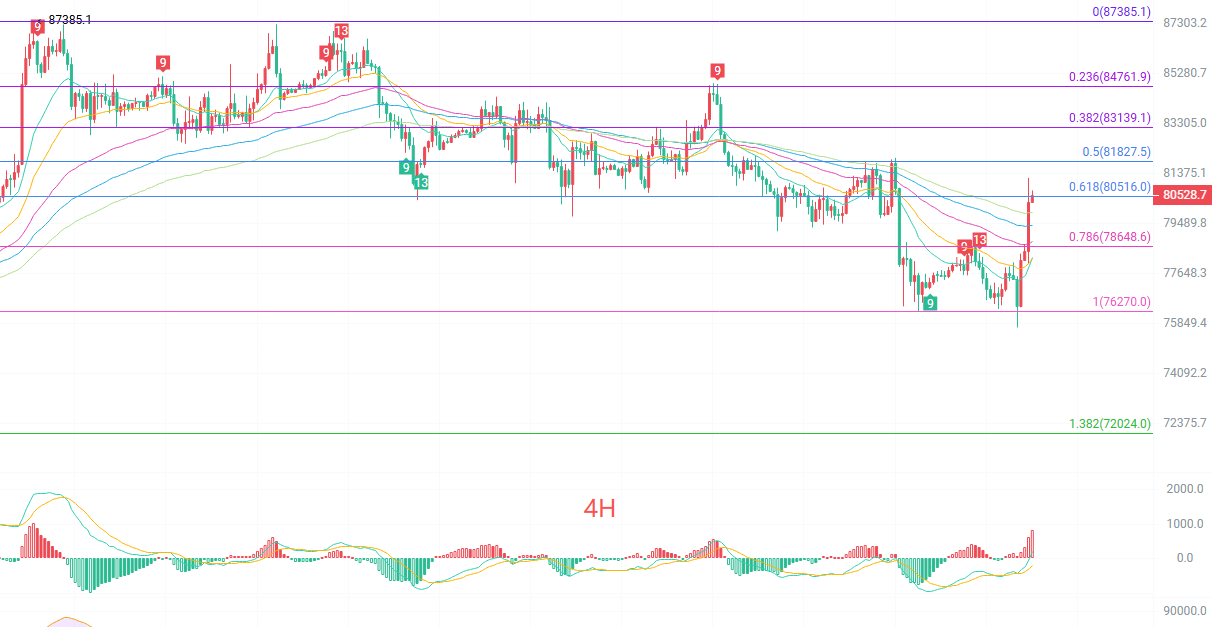
The four-hour K-line rebound started from 74,909, ran up to a high of 80,480, and is now consolidating near 80,400. Short-term EMA15 at 78,231 and EMA30 at 78,193 have just crossed upward, but price has drifted quite far from the short-term averages, suggesting a possible pullback. MACD has formed a golden cross below the zero axis, with bullish momentum still being released. The upper Bollinger Band at 79,868 has been breached, with price extending beyond the band’s edge—signs of being overbought in the short term. Watch the 79,500–80,000 range: if a pullback holds above this, the rebound could continue.
Short-term reference:
Going north: Resistance expected between 79,800 and 79,300, stop-loss at 500 points, target 82,000 to 84,000.
Going south: If momentum stalls between 82,000 and 83,000, stop-loss at 500 points, target 81,000 to 80,000.
For specific strategies, rely on real-time order book data. For more information, you can contact the author. Articles are published with a delay and are for reference only—trade at your own risk.